Case Study
Observability
End-to-end distributed tracing, structured logging, and dashboards across 16 services — so every request is debuggable from browser to database.
The Problem
A single request in this system can touch five or more services: gateway, monolith or microservices, AI service, MCP server, and background processors. Without correlated telemetry, a failure in one service looks like a mystery in another.
Most portfolio projects treat logging as an afterthought — a few console.log statements or uncorrelated log files. That doesn't reflect how production distributed systems are actually operated.
The Solution
Every service is instrumented with OpenTelemetry. Traces follow the W3C TraceContext standard, propagating through HTTP calls, Dapr pub/sub messages, and background processors. A single TraceId follows a request from the Angular frontend through the gateway, into whichever backend path is active, through messaging, and back.
Jaeger visualizes distributed traces. Grafana shows API latency, error rates, throughput, and provides trace-to-logs correlation — click a trace span and see the structured logs from that service in context. Health checks monitor liveness and readiness for every service.
Architecture
Each .NET service configures OpenTelemetry through a shared extension method. The OTLP exporter sends traces and metrics to a centralized OpenTelemetry Collector, which fans out to Jaeger (traces) and Grafana (metrics via Prometheus).
Trace context propagation through messaging is the hard part. When a service publishes a Dapr event, the W3C traceparent header is included in the message metadata. The consuming service extracts it and creates a child span, maintaining the trace across async boundaries.
What You See
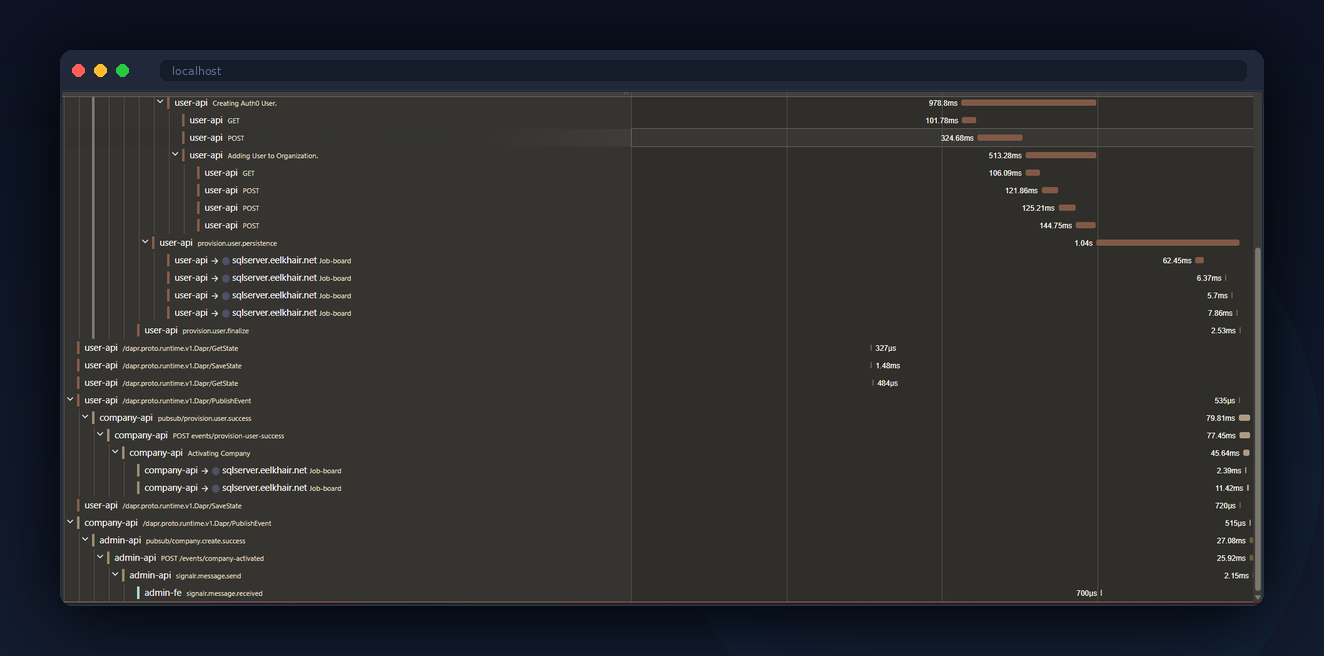
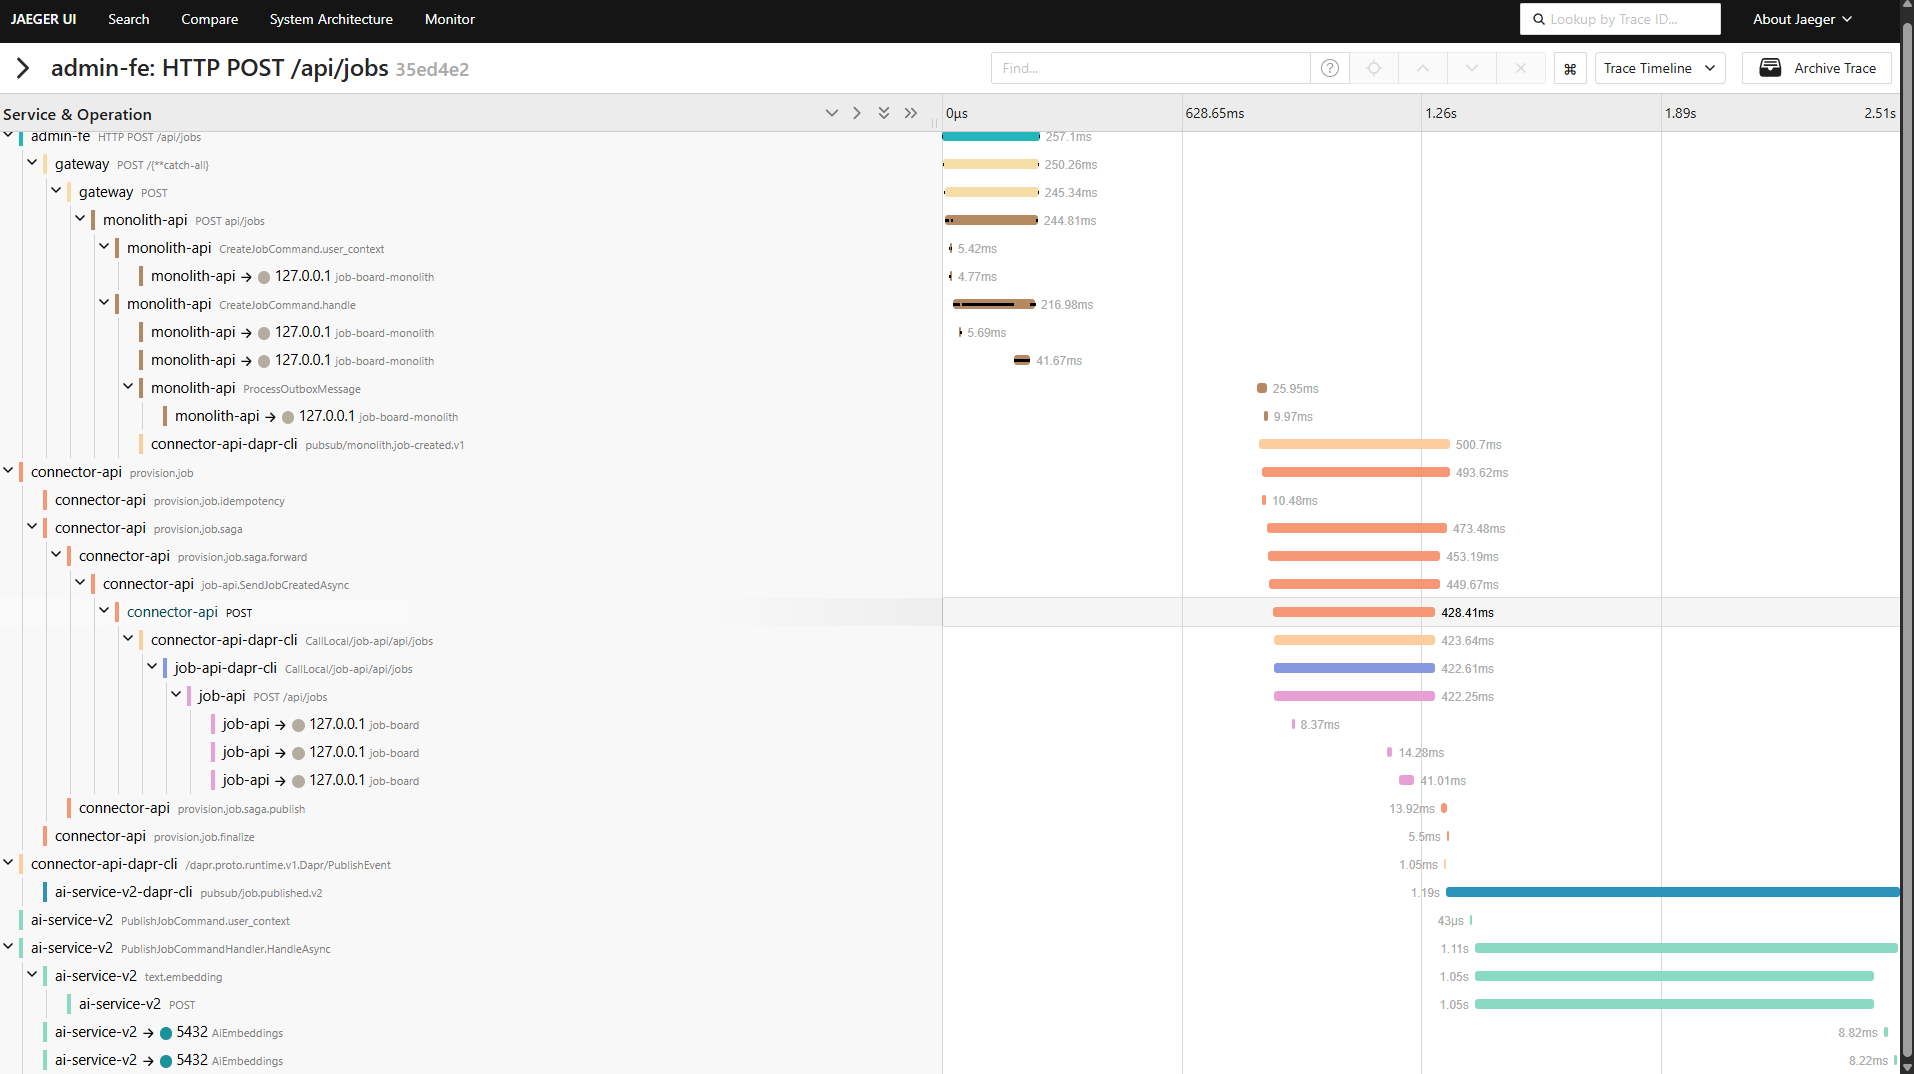
Click "Create Company" in the admin app. The API response includes a TraceId header. Click the Jaeger link in the admin toolbar. You'll see the full trace: gateway to monolith, outbox dispatch, connector saga fanning out to three microservices, reverse connector syncing back.
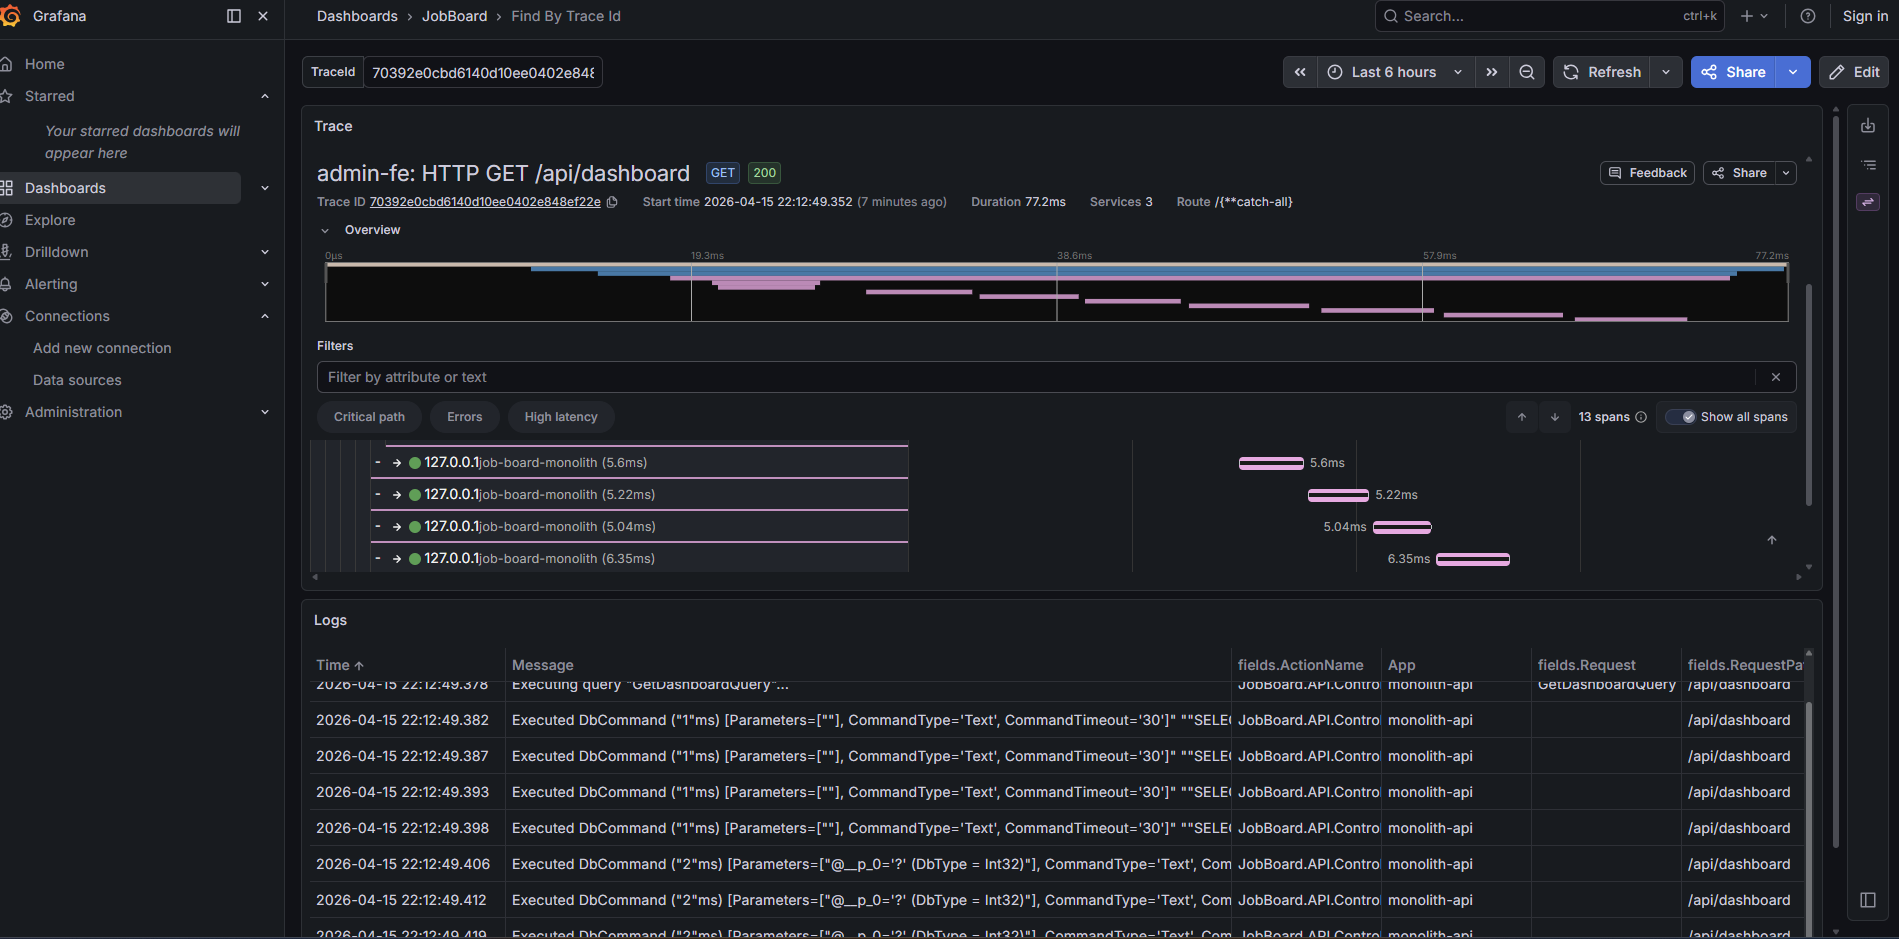
Open Grafana and check the API dashboard. You'll see request latency percentiles, error rates by endpoint, and throughput over time. Filter by TraceId to correlate a specific request's metrics with its trace. Click into a trace span and Grafana shows the structured logs from that service in context — no context switching between tools.
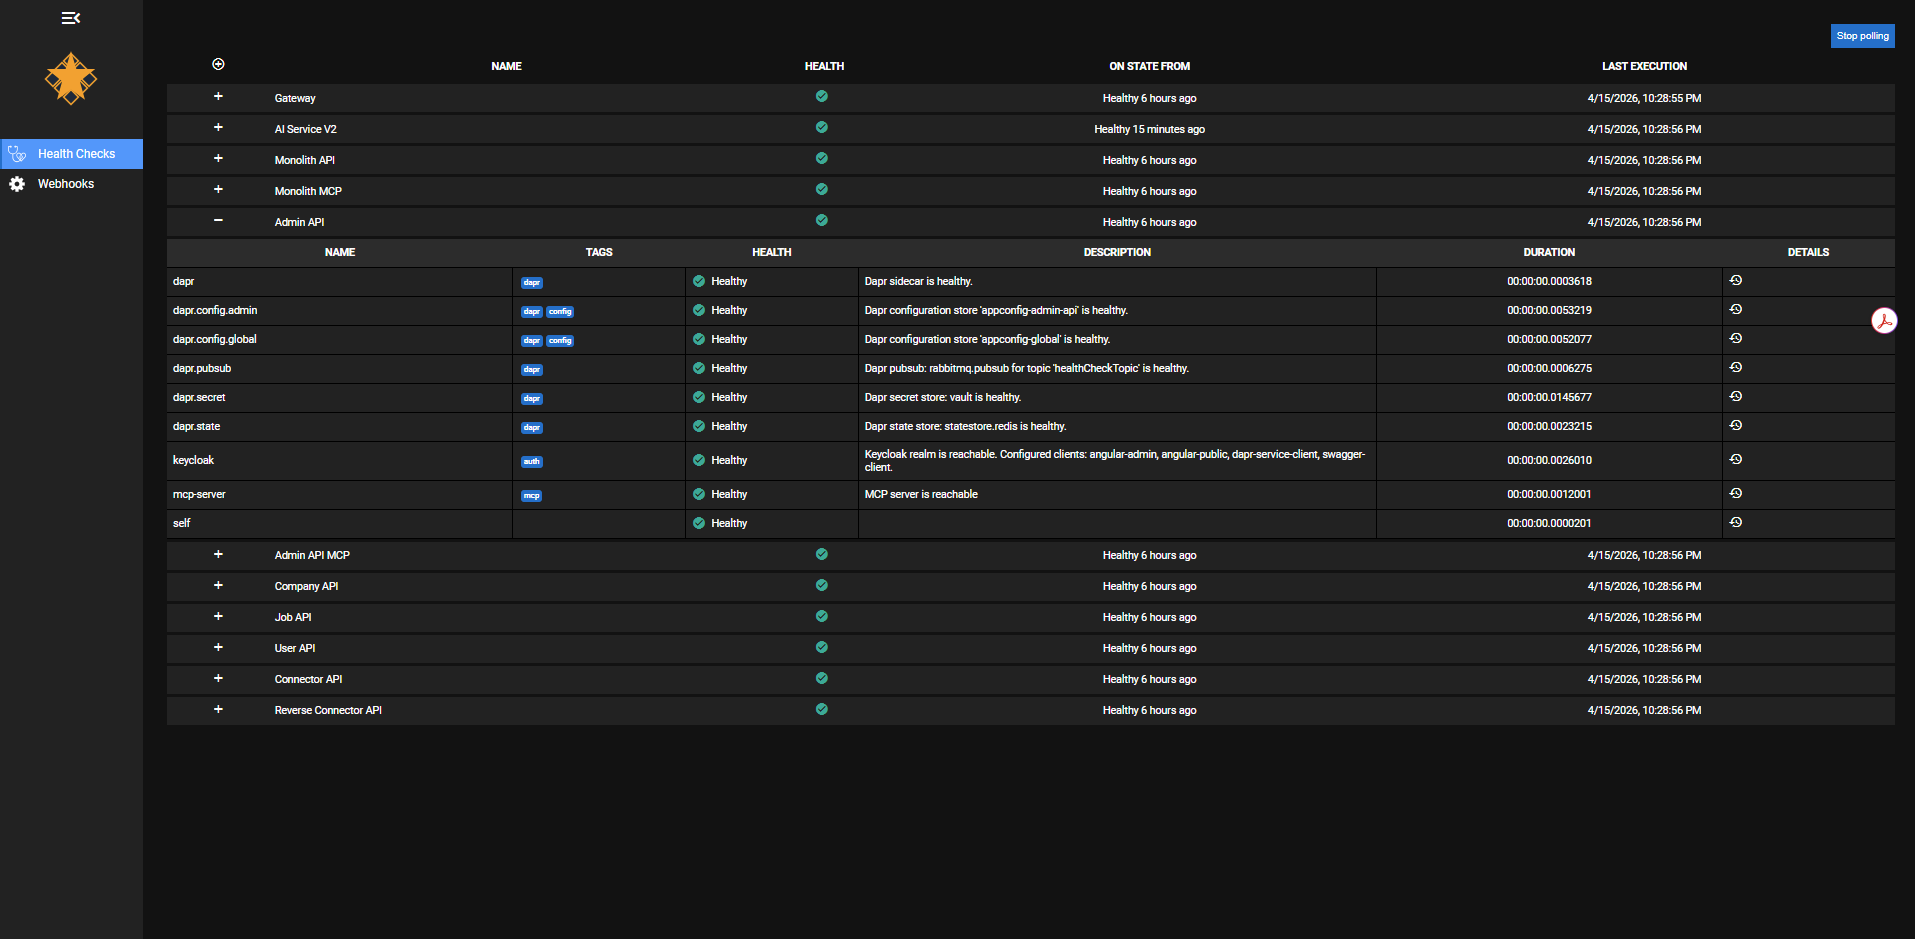
The health checks dashboard shows the status of every service at a glance. Expand any service to see its individual checks: Dapr sidecar connectivity, pub/sub topic health, config store availability, secret vault access, Keycloak realm reachability, and MCP server status. Each check reports independently — you can tell the difference between "the service is up but can't reach Redis" and "the service is down."
Behind the Scenes
Custom Activity spans wrap the CQRS decorator pipeline. Instead of generic span names like "POST /api/companies", the traces show business-meaningful names like "CreateCompanyCommand" and "PublishOutboxEvents". This makes traces readable without needing to map HTTP paths back to domain operations.
The health check system separates concerns: liveness checks confirm the process is running, readiness checks confirm dependencies (database, Redis, RabbitMQ) are reachable. The health dashboard aggregates all services and shows which are ready to serve traffic.
The admin Angular app includes the TraceId from API responses in the toolbar, with a direct link to Jaeger. This closes the loop — a developer or visitor can go from a UI action to a full distributed trace in one click.
Key Decisions
OpenTelemetry over vendor-specific SDKs
Why: OpenTelemetry is vendor-neutral. The same instrumentation works whether you export to Jaeger, Datadog, or Azure Monitor. Switching backends is a configuration change.
Alternative: Application Insights SDK or Datadog APM. Both provide richer out-of-the-box dashboards but create vendor lock-in.
W3C TraceContext through messaging
Why: Without trace propagation through async messaging, traces break at the publisher. You see the API call but not the downstream processing. W3C TraceContext is the standard.
Alternative: Custom correlation IDs in message payloads. Simpler but doesn't integrate with the standard tracing ecosystem.
Business-named spans over framework defaults
Why: Default ASP.NET Core spans are named after HTTP methods and routes. "CreateCompanyCommand" tells you more than "POST /api/companies".
Alternative: Rely on framework-generated spans only. Less work upfront but harder to debug.
Separated health checks by concern
Why: A service that can't reach its database shouldn't receive traffic, but it's still alive (don't restart it). Separating liveness from readiness prevents unnecessary restarts.
Alternative: Single health endpoint that checks everything. Simpler but conflates restart with traffic routing.
Tradeoffs & Lessons Learned
- Instrumentation discipline: Every new service, every new handler, every new integration needs spans and structured logging. It's a habit that has to be enforced from day one.
- Trace storage costs at scale: Jaeger's in-memory storage works for a portfolio but wouldn't survive a restart in production. A real deployment would use Elasticsearch or Cassandra.
- Span overhead: Each span adds 2-5ms of overhead. For hot paths with many nested spans, it's measurable. Production systems typically use sampling to reduce this.
- Dashboard maintenance: Grafana dashboards drift unless someone owns them. Treating dashboards as code (provisioned from JSON) helps but doesn't eliminate the problem.